• Members Only
    • Login

Canadian Association for the Club of Rome

Become active - It's your duty!

  • About
    • About the Club
    • Meet our Directors and Members
    • CACOR Groups
  • Articles
    • Climate
    • CACOR Groups
    • Quotes
    • Trending
    • CACOR Writers
    • What are you doing
    • Solutions & Pathways
    • CACOR YouTube
  • Events & Resources
    • Luncheon Events
    • CACOR Forum
    • Presentations
    • Resources
    • Announcements
  • Contact Us
  • Membership

CACOR is a non-governmental organization
dedicated to intelligent debate and action on global issues.

2018-11-15

How Much – What is Value?

Minutes of Minimum-Wage-Work to buy a Big Mac

How many minutes a minimum-wage-worker  would have to work to earn enough money to buy a Big Mac?

How do we relate the value of work, food etc.?  Why do Indians or Indonesians look to other fast or street food.

Minutes for Big Mac - big

Country Big Mac price Monthly minimum wage Currency Minutes of work to buy a Big Mac
Argentina 55 8060 ARS 70
Australia 5.8 2914.6 AUD 21
Austria 3.4 1387 EUR 25
Belgium 4 1051.3 EUR 39
Brazil 16.5 880 BRL 194
Canada 6 2184 CAD 28
Chile 2450 264000 CLP 96
China 19.6 1260 CNY 161
Colombia 9900 737717 COP 138
Costa Rica 2250 286467.4 CRC 81
Czech Republic 75 11000 CZK 70
Egypt 27.5 1200 EGP 236
Estonia 3.1 470 EUR 68
France 4.1 1457.5 EUR 29
Germany 3.8 1838.7 EUR 21
Greece 3.4 511 EUR 69
Hong Kong 19.2 5622.5 HKD 35
Hungary 900 127650 HUF 73
India 170 4160 INR 422
Indonesia 31000 1337645 IDR 239
Ireland 4 1347.8 EUR 31
Israel 16.9 5000 ILS 35
Japan 380 148512 JPY 26
Korea, South 4400 1119310 KRW 41
Malaysia 8 920 MYR 90
Mexico 49 2433.2 MXN 208
Netherlands 3.6 1124.9 EUR 33
New Zealand 6 3172 NZD 20
Pakistan 375 14000 PKR 276
Peru 11 850 PEN 134
Philippines 133 14174.17 PHP 97
Poland 9.6 1344 PLN 74
Portugal 3.1 530 EUR 60
Russian Federation 130 7500 RUB 179
South Africa 26.3 2602.7 ZAR 104
Spain 4 655.1 EUR 63
Sri Lanka 350 10000 LKR 361
Turkey 10.8 1777.5 TRY 63
Ukraine 42 3200 UAH 135
United Kingdom 3.1 1245.6 GBP 26
United States of America 5.1 1254.25 USD 42
Vietnam 60000 2580000 VND 240

Who eats the most big Macs per person, and does this relate to the charts above?   The map and list below shows which countries eat the most meat per capita.

The USA is the per capita leader in Big Mac consumption.

Current Worldwide Annual Meat Consumption per capita

<div id=”no-chart”>Hello, you have JavaScript turned off. Please enable JavaScript to see this interactive data visualization.</div>

Current Worldwide Annual Meat Consumption per capita

This map shows current worldwide annual Meat Consumption per capita.  World average meat consumption: 41.90 kg per person per year


6 years ago

Food & Agriculture
world consumption environment food meat

countries
2009
2008
2007
2006
2005
2004
2003
2002
2001
2000
Albania 44.1 43.7 48.7 44.8 41.2 40.8 39.5 39.9 33.6 29
Algeria 19.5 19.4 20.1 20.2 21.6 21.4 18.9 17.4 17.5 19.1
Angola 22.4 23.7 20.9 19.3 18.4 16.8 19 18.1 14.8 16.4
Antigua and Barbuda 84.3 87.9 81.8 77.9 76.8 67.5 66.8 67 68.4 69
Argentina 98.3 96.5 93.9 92.8 88.7 86.4 83.3 79.7 93.8 98.2
Armenia 45.8 53.5 41.6 30.1 29.2 26.8 24.9 23.2 21.9 21.2
Australia 111.5 111.6 121 109.9 115.5 106.1 115.9 108.2 108 109.5
Austria 102 101 105.9 104.1 108 111.7 110.7 110.7 109.5 113.5
Azerbaijan 32 23.8 24.2 20.1 19 18 17.4 16.1 15.6 16.4
Bahamas 109.5 108.9 107.2 107.8 105.1 102.8 106 116.6 108.3 107.2
Bangladesh 4 4 3.9 3.8 3.8 3.7 3.6 3.6 3.5 3.5
Barbados 74.5 72.2 79.9 71 78.7 65 66.5 67.1 68.1 69.4
Belarus 78.4 76.5 72.2 67.7 60.9 58.7 58.4 57.7 58.8 58.9
Belgium 76.9 79.2 83.4 79.3 81.9 78.6 80.4 84.3 86.8 82
Belize 42.5 44.6 45.9 44.9 47.3 49.3 48.3 49.9 45 40.8
Benin 20.9 20.4 15.9 14 14.1 15.3 19.5 19 14.3 16.1
Bermuda 101.7 97.2 98.3 94.3 80.6 78.1 91.9 96.2 94.4 99.9
Bolivia (Plurinational State of) 59.1 58.6 57.1 51.8 51.4 50.6 50 50 49.3 48.6
Bosnia and Herzegovina 27.9 25.3 21.3 19.7 21.1 19.7 19.6 23 20.2 17.8
Botswana 26.2 27.5 24.5 25.4 27.9 26.2 19.8 23 20.8 23.2
Brazil 85.3 86.3 80.6 78 74.6 81.3 79.7 78.7 76.4 79
Brunei Darussalam 67.5 67.7 65.8 61.3 61.4 68.3 61.1 59.1 66 60.5
Bulgaria 53 50.5 46.1 47.7 51.1 51.9 46.4 54.7 56.4 57.6
Burkina Faso 14.8 14.7 15.9 16.2 15.8 15.5 15.3 15 14.8 14.5
Burundi 5.2 4.8 5.1 5 4.1 4.1 4 3.8 3.8 3.5
Cambodia 16.6 16.2 16.2 16.1 16.1 15.9 15.9 15.3 15.8 16.1
Cameroon 12.7 12.8 13.2 13.2 13.6 15.5 14.9 14.7 14.6 14.7
Canada 94.3 96.5 98.8 95.5 95.3 99.6 99.1 100.8 101.4 101.4
Cape Verde 46.1 43.3 41.5 38.3 36.3 33.4 31.1 27.7 28.3 25.5
Central African Republic 33.5 33.6 33.3 32.6 32.6 32.6 32.2 31.8 31.2 31.5
Chad 13 13 13 13 13.1 13.3 13.4 13.6 14 13.9
Chile 74.1 77.8 78 75.5 70.5 69.3 67.2 64.9 65.4 65.7
China 58.2 56.3 52.9 54.4 53.4 51.2 50.6 49.3 48.7 48.7
Colombia 46.5 45.1 43.6 42.3 39.9 37.2 35.6 36.1 35.8 35.2
Comoros 13.4 12 13.2 12.7 13.8 15.8 15.6 9.4 6.4 7.8
Congo 13.4 21.1 21.3 19.1 15.6 20.5 21.7 15.4 13.1 14.9
Costa Rica 51.1 49.7 50 45.7 43 41.7 41.4 39.7 42.9 42.5
Côte d’Ivoire 13.3 13.3 13.1 13.6 13.5 13.7 13.3 12.3 12 12.8
Croatia 66.3 61.8 61.8 57.2 49.2 48.6 42 40.1 35.3 35.4
Cuba 49.4 43.7 39.3 37.5 30.5 34.2 30.6 31.4 29.6 29.6
Cyprus 78.1 81 82.4 81.1 84.9 82.3 82.2 87.8 86.2 88
Czech Republic 83.4 83.5 85.1 84.1 86.6 85.5 79.7 77.5 76.7 76.5
Democratic People’s Republic of Korea 13.4 13 13.5 14 14.5 14.4 14.3 15.8 13.3 11.2
Denmark 95.2 97 96.6 96.9 100.7 110.8 111.7 112.1 113.8 113.4
Djibouti 23.7 25.4 31.6 26.5 19.9 15 15.2 14.6 15.4 16.4
Dominica 68.6 68.8 65.8 64.4 70.2 72.3 64 68.5 67.4 67.6
Dominican Republic 53.7 52.7 56.1 53.8 49.3 39.5 32.7 36.8 39.3 40.3
Ecuador 56.4 58.4 56.6 51.3 45.2 45.6 46.2 45.3 44.1 40
Egypt 25.6 24.5 27.4 24.5 22 21.1 20.3 20.2 19.6 22.4
El Salvador 28.3 28.2 30.1 29.8 27.4 25.4 23.5 25.6 23.1 21.1
Eritrea 7.7 6.9 8.2 7.2 7.6 7.9 8.4 7.7 8.3 9
Estonia 59.6 59.2 59.9 56.7 59.6 54.1 60.9 64 60.8 59.1
Ethiopia 8.5 8.4 8.4 8.4 8 7.9 7.9 8.2 7.3 7
Fiji 38.8 44.5 44.2 47 45.5 44.5 41.8 41.4 42.1 44.9
Finland 74.8 76.2 74.1 72.3 72.8 72.6 70.6 68.4 67.7 66.6
France 86.7 86.9 88.6 85.9 91 93.5 98.4 99.8 102.7 100.9
French Polynesia 101.9 103.8 109.2 98.8 101.9 106.1 102.2 102.6 98.2 96.2
Gabon 66.4 57.7 58.6 60.8 58.2 54.5 45 45.8 47.4 47.4
Gambia 8.1 7.6 9.7 9.5 10.3 9.6 6.1 5.7 5.8 6.8
Georgia 25.5 26.3 28.2 26.8 31.3 29.6 29.8 29.4 26.1 28.4
Germany 88.1 87.8 88.1 84.3 83.8 84.2 84.3 82.2 82.7 84
Ghana 13.9 13.9 13.8 12 11.9 11.8 12.1 10.4 9.9 10.4
Greece 74.8 73 74.7 79.2 78.5 75.5 79.1 77.8 86.3 83.6
Grenada 61 58.5 55.3 70.4 66.6 58.4 56.6 59.4 45.4 50.2
Guatemala 28.8 28.4 28.7 26 27.8 27.5 26.6 27.2 24.3 23.3
Guinea 8.6 8.6 8.3 8 7.7 7.4 7.1 6.6 6.5 6.4
Guinea-Bissau 16.2 16 15.4 15.3 15 15.2 15.3 14.6 15.3 15.3
Guyana 39 38.3 40.4 34.1 36.6 38.8 38.5 33.5 32.1 37.9
Haiti 15.6 16.7 16 13.7 14.4 13.5 15.7 15 14 13.3
Honduras 34.3 36.5 35.8 34.4 35.2 32.3 31.1 28.5 23.9 25.3
Hungary 76 78.2 80.1 80.8 81.5 87.3 82 92.5 83.4 87.2
Iceland 86.2 92.9 94.4 89.7 83.5 84.1 86 84.7 80.4 81.7
India 4.4 4.3 4.3 4.1 4.1 4 3.8 4 4 3.9
Indonesia 11.6 11.2 10.8 10.9 9.9 10.4 9.9 9.5 8.5 8.2
Iran (Islamic Republic of) 36.3 35.5 34.1 31.9 29.9 29.4 28 25.5 25.3 24
Ireland 87.9 91.1 94.4 103.7 103.8 104.6 100.6 102.5 100.1 97.7
Israel 96 102.2 99.2 103.1 101 100.8 99.8 99.1 91.8 85.3
Italy 90.7 89.2 91.5 88.5 88.1 89.1 89.5 92.4 93.1 91.6
Jamaica 59.1 64.1 64.7 60.4 62.2 62.8 62.5 57.3 54.9 54.3
Japan 45.9 46.8 46.4 46.1 46.9 44.5 45.1 44.7 44.8 45.3
Jordan 42 44.1 43.7 38.3 39.1 40.5 35.8 35.4 36.8 36.1
Kazakhstan 62.6 63.7 63.6 61.9 56.3 52.3 49.1 46.8 44.6 41
Kenya 16.7 16.4 16.4 16.4 15.6 14.7 14.5 14 13.1 12
Kiribati 38.5 37.6 38.1 37.7 40.8 36 35.4 32.1 32.3 28.3
Kuwait 119.2 110.5 94.4 84 110.7 92.8 76 69.9 78.4 73.1
Kyrgyzstan 36.9 34.5 33.9 34.6 35 36 35.5 37.7 38.6 38.6
Lao People’s Democratic Republic 21.3 20.2 18.5 18.1 17.4 17.1 16.8 15.1 14.7 13.9
Latvia 61.5 62.7 60.7 57.9 57.4 53.7 51.5 45.7 39.4 36.8
Lebanon 58.8 52.4 51.5 50.4 49.3 49 48.3 46.5 43.2 44.7
Lesotho 18.3 18 17.9 21.2 17.2 16.7 16.4 16.5 16.5 16.2
Liberia 10.4 10.9 10.2 9 10.6 11.2 8.6 8.6 8.7 9.9
Libya 33.5 35.6 33.5 30.3 29.5 32.7 27.5 28.8 30.2 31.3
Lithuania 78.2 86.7 81.4 75.7 72.9 69.1 61.2 52.3 41.6 49.2
Luxembourg 107.9 116.1 112.3 114.9 117.8 114.9 112.9 112.2 106 118.2
Madagascar 14.7 15.1 15 15 14.4 13 13.2 13.1 13.8 16
Malawi 8.3 7.3 6.1 5.4 5.5 5.5 5.4 5.3 5.6 5.5
Malaysia 52.3 49.2 50.9 51.5 49.8 49.4 47.6 47.3 46.6 44.7
Maldives 21.6 23.5 21.2 21 19.4 20.3 18.7 15.6 14.1 14.1
Mali 22.2 21.7 20 19.4 20.1 19.3 19.6 18.2 17.6 16.6
Malta 84.5 85 88.4 82.2 81.1 83 80.2 75.9 75.3 77
Mauritania 29.7 29.2 31.2 31.3 32.4 32.7 33.4 33.4 32.3 31.6
Mauritius 49.4 47.8 46 44.1 42 42.2 39.7 39.6 38.2 34.7
Mexico 63.8 63.3 62.3 62 61 59.2 58.2 58.7 56.9 55.1
Mongolia 82.1 80.5 70.2 65.8 70 73.4 70.2 74.7 86.8 100.1
Montenegro 57.7 55.6 53.3 50.2
Morocco 30.1 27.8 25.1 24.5 24.1 22 22.2 22 20.9 20.9
Mozambique 7.8 7.8 8.4 7.6 9.7 9.1 8.5 10.3 10.2 10.8
Myanmar 32.1 32.4 29.6 26.8 23.6 19.8 17 14.1 11.7 10.5
Namibia 28.3 38 30.9 30.2 31.4 32.9 33.3 30.6 37.3 42.8
Nepal 9.9 9.8 9.7 9.6 9.7 9.6 9.6 9.6 9.7 9.7
Netherlands 85.5 84.8 71.4 78.3 74.1 75.5 65 78.9 87.6 87.8
Netherlands Antilles 91 89.8 81.6 85.6 90.8 85.1 82.6 84.5 91.8 94.9
New Caledonia 72.6 73.3 74.9 67 70.6 72.9 68.4 66.7 65.9 60.8
New Zealand 106.4 116.4 115.7 108.9 102.7 108.8 107.3 104.7 101 92.5
Nicaragua 25.3 25.2 24.8 23.4 20.5 19.7 18.7 16.5 17.9 16.2
Niger 25.6 24.3 24.2 23.6 23.8 23.4 22.6 22 21.2 20.6
Nigeria 8.8 8.7 8.7 8.5 8.7 8.8 8.7 9 8.9 8.5
Norway 66 69 65.4 65 66.1 64.5 62.2 61.9 61.6 60.8
Occupied Palestinian Territory 21.3 21.4 21 24.4 29.1 26 28.3 32.1 30.6 31.7
Pakistan 14.7 14.4 14.2 13.8 12.2 12.1 12.1 11.9 11.8 11.7
Panama 63.5 62.2 60.2 58.4 56.7 54.9 55 57.6 59.2 60.6
Paraguay 41.9 41.8 43.8 48.9 46.6 52.1 62.2 73.3 65.6 70.5
Peru 20.8 20.7 20.7 19.7 18.7 17.5 17.4 17 16.5 16.6
Philippines 33.6 33.7 33.1 31.3 29.8 30.3 30.8 30.4 29.4 28.9
Poland 76.9 74.3 77.6 76.1 73 73.6 75.3 74.1 70.8 70.8
Portugal 93.4 92.9 93.8 87.5 85.2 84.4 83.2 85.6 87.3 87.6
Republic of Korea 54.1 55.6 56.4 54.7 49.8 45.1 53.1 50.3 43.6 47.6
Republic of Moldova 26.8 29.6 32.2 31.1 31.2 26.2 24.6 23 23 19.5
Romania 64.7 61.5 62.6 62.6 63.5 54 60.2 54.8 48.8 47.8
Russian Federation 62.9 64.2 60.3 55.8 52.1 50 51.8 50 45.6 39.9
Rwanda 6.5 6.5 6.3 6.1 5.7 5.7 5.4 4.9 4.8 4.6
Saint Kitts and Nevis 70.8 71.7 69.6 75 75.7 91.7 79.3 81.4 75.3 76.9
Saint Lucia 93.6 91.7 93.9 90.1 93.7 98.7 91.6 91.1 92.8 99.1
Saint Vincent and the Grenadines 91.4 92.3 90.1 86.5 82.5 83.1 80 77.5 65.5 66.1
Samoa 87.2 86.8 80.7 72.4 84.2 79.7 84.7 81.2 84.3 73.8
Sao Tome and Principe 16.5 14 13.9 13.5 13.7 12.6 14.1 9.6 8 7.9
Saudi Arabia 54.4 51.2 52.9 51.3 53.5 48.7 50.8 49.2 50.8 53.3
Senegal 15.8 15.2 14.1 14.8 13.5 12.9 12.7 12.7 13 12.4
Serbia 45.2 45.3 44.9 41.1
Serbia and Montenegro 82 79.2 82.2 86.8 79.6 87.7
Seychelles 35.6 26.5 34.7 36 30.5 24.5 34.1 24.1 27.5 29.4
Sierra Leone 7.3 7.3 7.3 6.9 6.6 6.8 7.1 7.3 5.3 6.1
Slovakia 60.4 60 58.8 60.9 64.5 61.4 64.1 60.1 53.7 57
Slovenia 88.3 88.9 83.8 86.2 90.6 88.3 92.8 81.7 86.5 92.8
Solomon Islands 11.9 11.4 10.7 10.4 9.6 9.2 8.8 9.7 7.6 7.6
South Africa 58.6 57.7 53.6 50.1 46.3 43.8 42.3 40.2 39.2 41.7
Spain 97 101.7 110.2 106.4 107.3 108 118.4 119.5 115 113.7
Sri Lanka 6.3 6.5 6.7 5.8 6.9 6.8 6.6 6.4 6.3 5.4
Sudan (former) 19.1 19.5 20.1 20.9 21.5 20 20.2 19.7 20 19.1
Suriname 47.5 47.5 47.2 41.4 39.5 38.3 37.2 40.3 39.3 40
Swaziland 26.9 27.5 28.4 30.1 33.2 46.8 35.8 33.9 26.9 25
Sweden 80.2 79.6 78.7 77 77.4 77 76.4 74.7 70.2 69
Switzerland 74.7 75.4 73.6 72.3 72.4 72.2 72.2 72.7 72.2 71.5
Syrian Arab Republic 22.8 22.8 24.2 23.2 22.3 22 21.5 17.9 20.5 21.9
Tajikistan 14.7 15 12.8 9.5 10.5 9.1 9.7 9.3 8.2 8.8
Thailand 25.8 27.2 29.9 28.4 27.4 26.1 27.2 25.8 25 26.3
The former Yugoslav Republic of Macedonia 40.8 38.9 49.9 37.9 38 40.2 37.8 37.3 30.5 31.6
Timor-Leste 33.8 33.1 33.4 33 32 39.7 40.3 41.3 40 38.5
Togo 11.7 11.5 9.9 9.8 9.5 9.6 10.1 9.7 9.5 9.4
Trinidad and Tobago 47.7 47.1 47.9 42.6 42.2 43.5 38.8 37.2 36.9 36.6
Tunisia 25.9 26.5 26.8 24.4 25.5 26.5 25.6 27.5 27 26.9
Turkey 25.3 24.2 25.5 22.5 22.7 23.1 22.1 20.7 20.1 21.9
Turkmenistan 58.6 57.7 54.6 44.2 44.4 44.9 45.1 41.7 35.7 33.9
Uganda 11 11 11.2 11.1 11.6 11.6 11.8 11.5 11.3 11
Ukraine 48.5 51.1 44.8 41.6 38 38.8 34.3 32 30.3 31.2
United Arab Emirates 73.8 78.7 75.7 70.9 72.1 74.8 91.9 88.7 74.7 72.8
United Kingdom 84.2 81.5 85.5 86.2 84 85.3 83.3 80.4 78.5 77.4
United Republic of Tanzania 9.6 9.8 10 10.2 10.3 10.4 10.7 10.6 10.5 10
United States of America 120.2 124.4 126.7 126.6 126.2 126.5 123.9 125.3 121.8 122.6
Uruguay 55.3 61.2 56 53.7 63.5 55 53.9 71.9 79.8 88.4
Uzbekistan 28.4 27.2 26 26.5 25.1 24 22.7 20.8 20.4 21.1
Vanuatu 35.4 39.7 37.4 32.9 33 32.1 32.7 32.9 35.2 36.1
Venezuela (Bolivarian Republic of) 76.8 72.5 79.7 67.2 60.9 61.2 57.7 65.8 65.6 59.6
Viet Nam 49.9 45.6 42.5 38.6 35.5 32.4 30.4 28.5 26 24.2
Yemen 17.9 16.2 16.8 15.2 16.6 16.3 17.1 14.9 13.9 13.1
Zambia 12.3 12.1 12.5 12.6 13.8 13.4 14.1 14 13.6 13.5
Zimbabwe 21.3 19.4 19 18.6 18.2 17.6 16.3 15.3 17.1 13.4
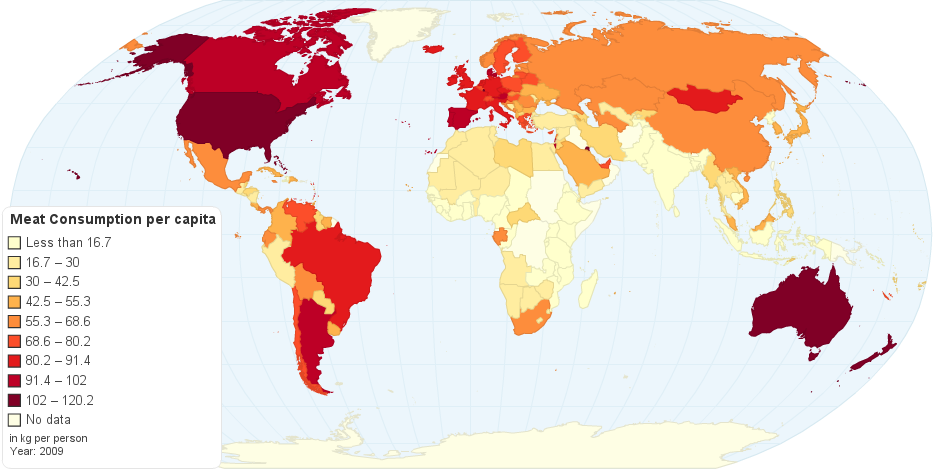
Which countries have the greatest capacity to reduce and which do not? Canada is in the highest quartile with a small downward trend.   Will new data show the continuation of this trend?

Source

  • FAO 2013, Current Worldwide Annual Meat Consumption per capita, Livestock and Fish Primary Equivalent, Food and Agriculture Organization of the United Nations, viewed 31st March, 2013, <http://faostat.fao.org/site/610/DesktopDefault.aspx?PageID=610#ancor>.

Citation

ChartsBin statistics collector team 2013, Current Worldwide Annual Meat Consumption per capita, ChartsBin.com, viewed 11th October, 2018, <http://chartsbin.com/view/12730>.

Article posted by Ted Manning / Articles, Trending / consumption, food, Value Leave a Comment

Read more articles like this. Sign up for our latest updates.

Leave a Reply Cancel reply

Your email address will not be published. Required fields are marked *

STAY INFORMED

Read more articles like this. Sign up for our latest updates.

Upcoming Events

  1. Can Canada find a pathway from Paris to 2030?

    February 26 @ 09:00 - August 2 @ 17:00
  2. Plan to Survive

    February 27 @ 00:00 - April 30 @ 00:00

View All Events ...

Recent Articles

  • Green Drinks February – Energy Evolution
  • Fossil Fuel Air Pollution Linked To 1 In 5 Deaths Worldwide, New Harvard Study Finds
  • Paleoclimates help us to forecast future climates

Topics

Monthly Archives

Connect with us

Membership

Apply for membership.
 

Apply

Donate

CACOR is a registered charity.

Donate

Details

  • Privacy Policy
  • Disclaimer
  • FAQ
  • Sitemap

© 2021 · Canadian Association for the Club of Rome · Built by Creative Integration Web Design · Contact Us

Copyright © 2021 · CACOR Theme on Genesis Framework · WordPress · Log in